
 Tabalyst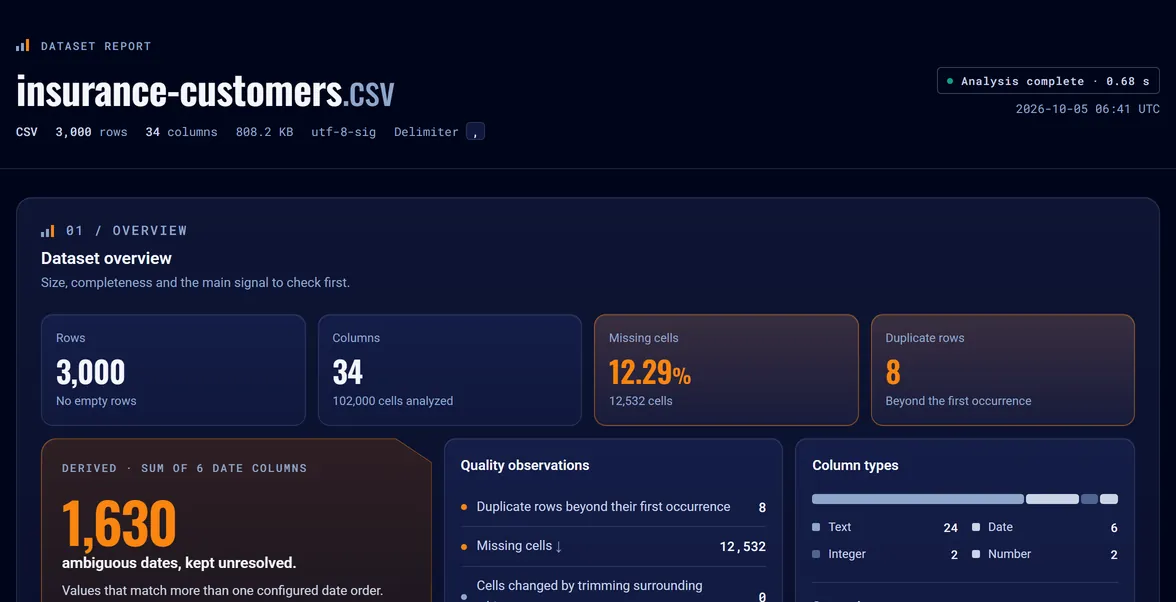
DOCS
Report guide
Commands, options and outputs of Tabalyst Report.
Tabalyst for data professionals
Before the first chart or the first model, see what the file holds: how complete it is, what each column contains, where values are rare or inconsistent. Tabalyst Report reads the whole file on your machine and gives you an interactive report to explore.
tabalyst report insurance-customers.csv
Analyzed 3,000 rows and 34 columns.
Report: insurance-customers.html
tabalyst sample insurance-customers.csv --sample-method random --rows 1000 --seed 42
Sample created successfully.
Source rows: 3,000
Sample rows: 1,000
Real output of tabalyst 0.6.0, paths shortened. Some lines of the sample summary are left out.
Your angle
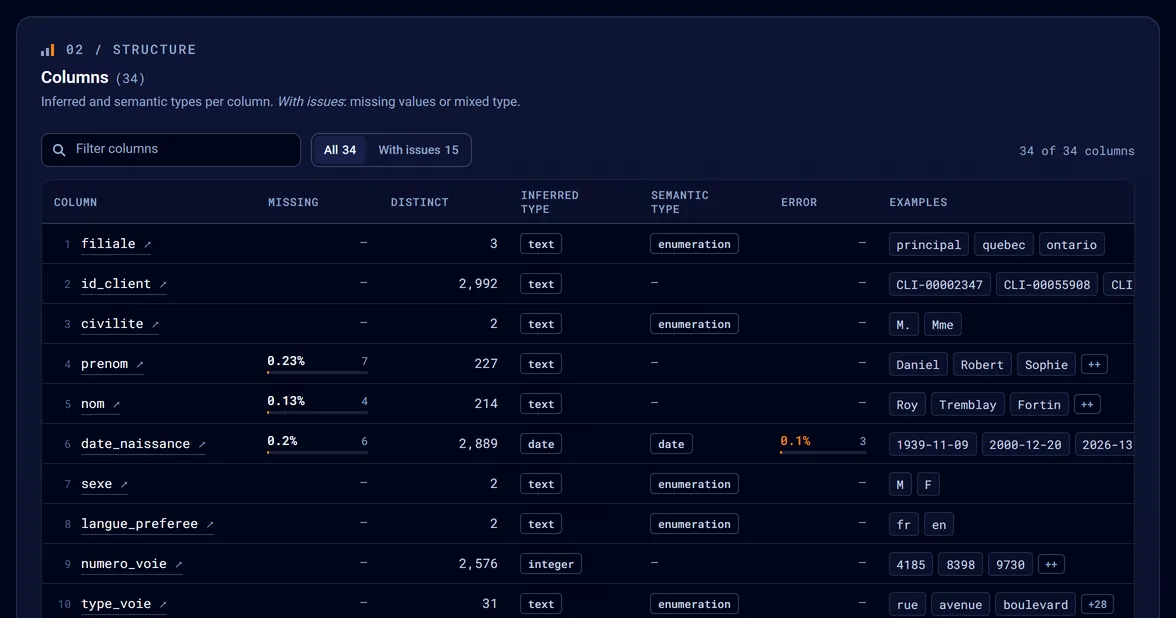
Rows, columns, missing cells, duplicate rows and the types found, on one screen, before you open a notebook. In the example report, 15 of 34 columns carry an observation.
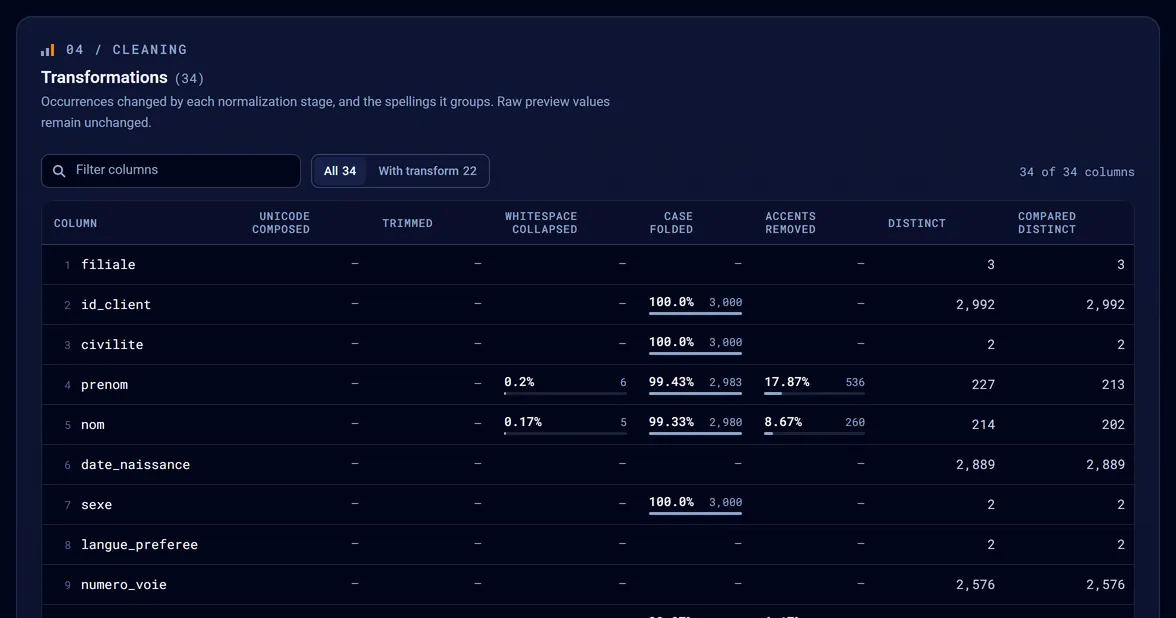
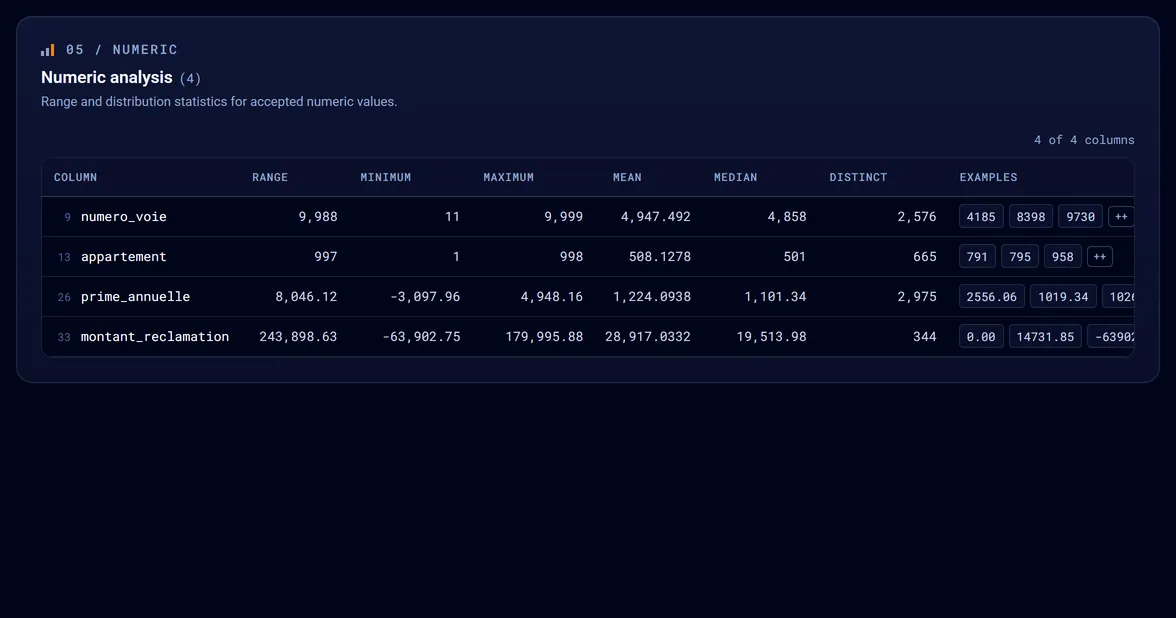
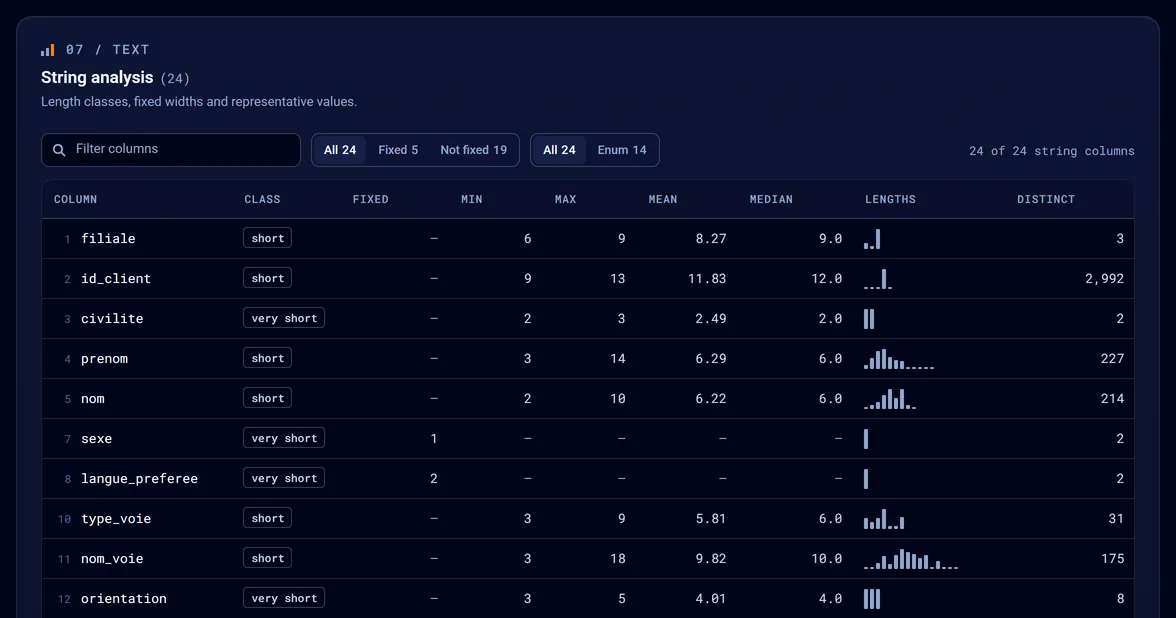
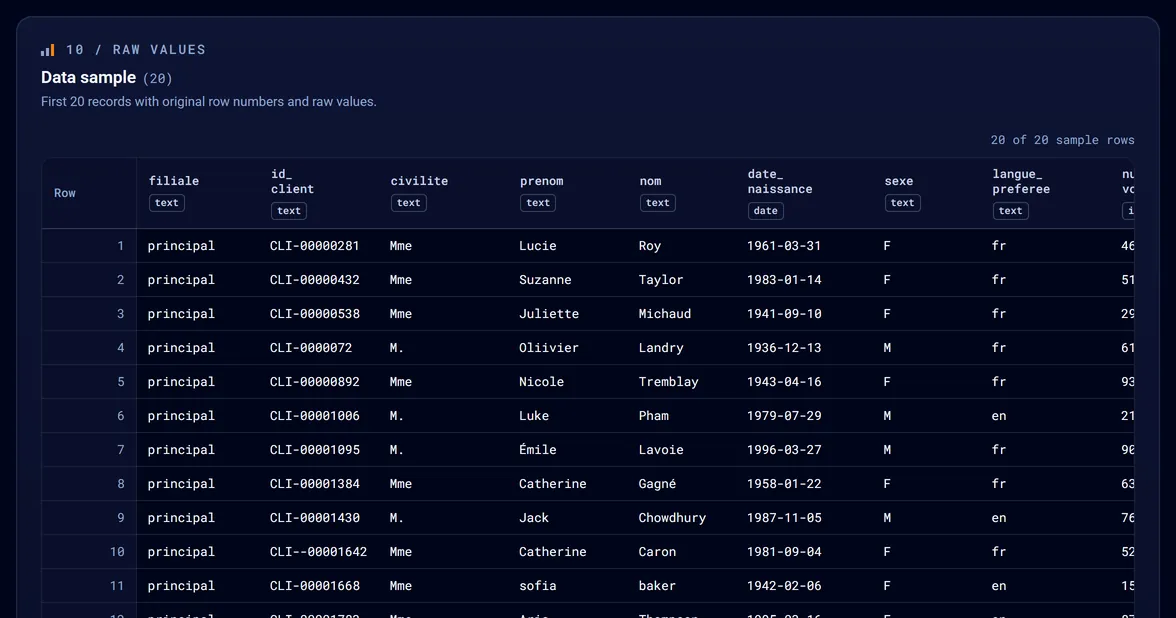
Range, mean and median of numeric columns, string lengths, the frequency of each value in a column with few distinct values, and representative examples. Odd spellings and rare values stand out.
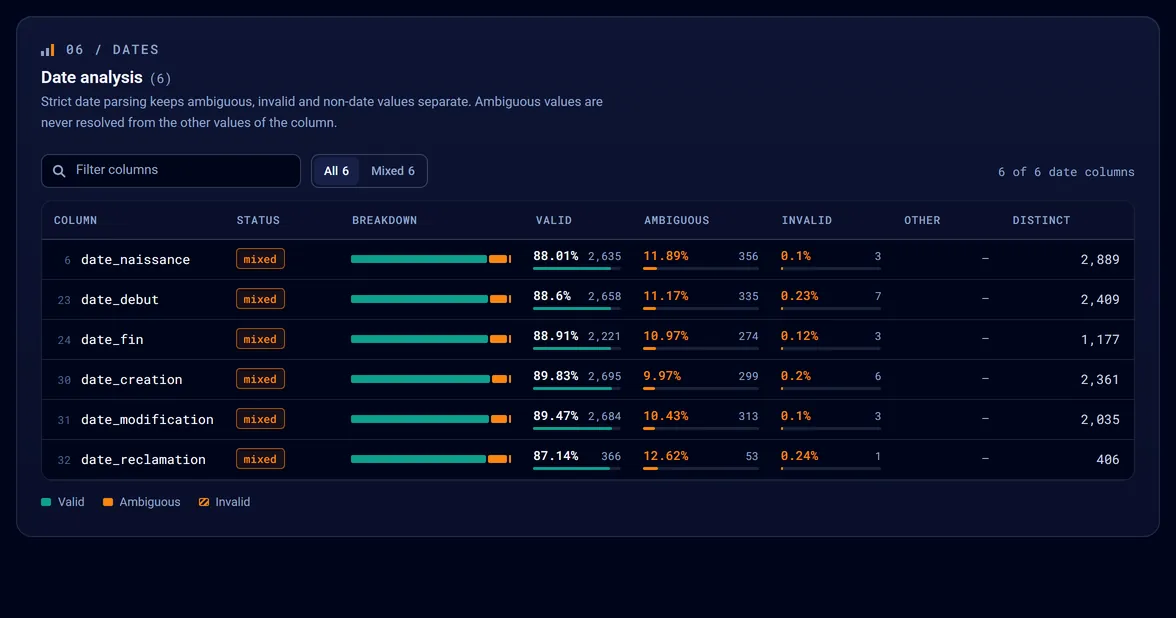
An ambiguous date stays ambiguous: the report shows the evidence of the column and does not choose for you. Missing values are counted by kind: absent, null, empty, blank, or a marker such as N/A.
Workflow
The report is one HTML file. Open it in a browser, work through its sections, and keep the JSON profile if you want the same facts in code.
pip install tabalyst# Also updates it: Tabalyst changes often
tabalyst report data.csv# data.html to explore, data.json for code, beside the source
tabalyst sample data.csv --sample-method random --rows 1000 --seed 42# data.sample.csv: a smaller CSV, the source is never modified
import tabalyst # The report and the profile of a fileprofile = tabalyst.analyze("data.csv", "reports/data.html") # A reproducible sample, to try ideas on a smaller filesample = tabalyst.sample_csv("data.csv", method="random", rows=1000, seed=42)print(sample.output)
Sampling methods are first, last, random and stratified, which approximately preserves the distribution of a field you choose. Sampling reads CSV files only.
Proof
TabalystReport
Explore the report
Report
Analysis
Data
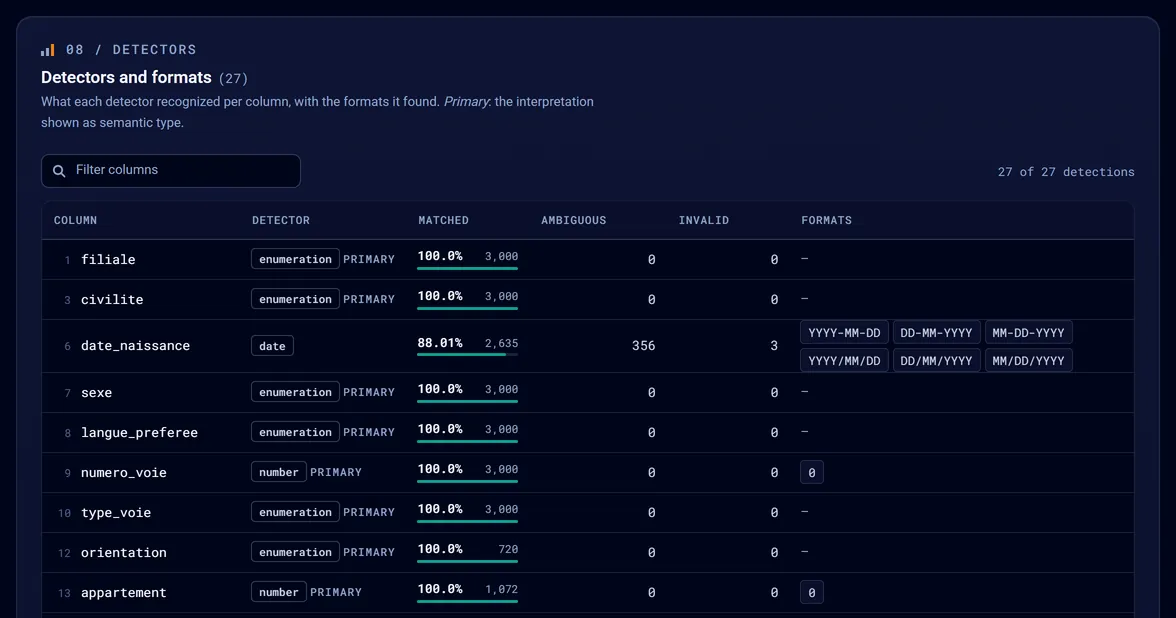
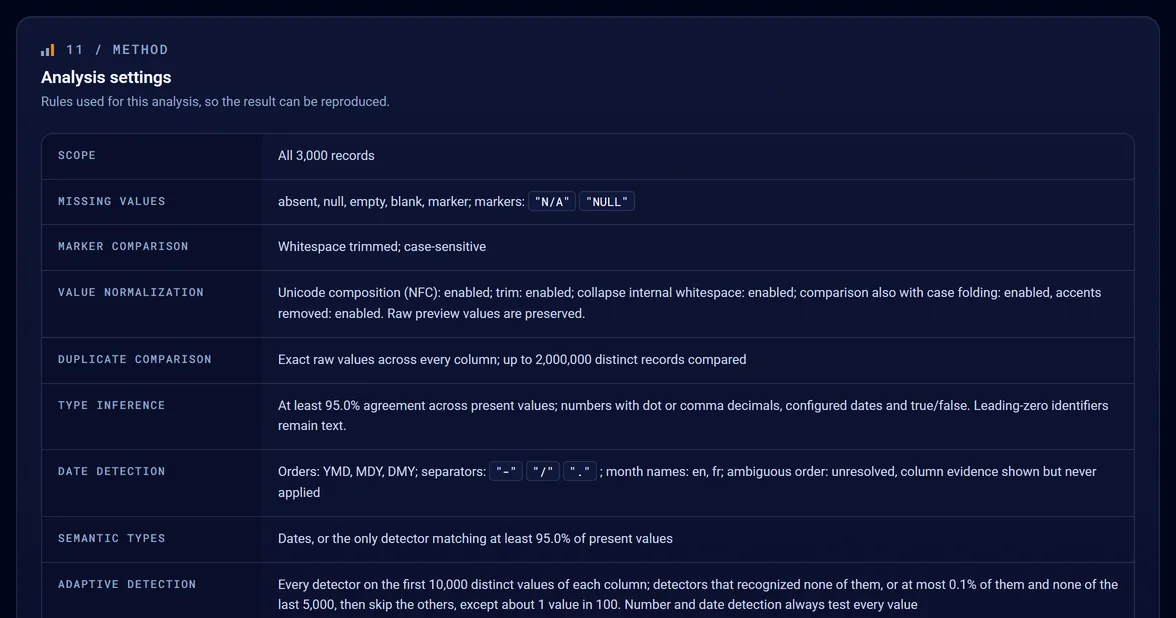
The demo shows screenshots of a report on 3,000 synthetic insurance customers. The full report and its profile are the files Tabalyst Report wrote.
Scope, not hype
The known limitations ↗ list the rest.
Next step
Tabalyst Report summarizes and profiles a file. Tabalyst Explore, which will filter and investigate it interactively, is still to come.
Coming soon Tabalyst Explore: guided investigation of your data
Use Tabalyst Report todayCommands, options and outputs of Tabalyst Report.
Random, stratified, first and last samples of a CSV file.
Your next dataset
Install Tabalyst, run it on your file and open the report.