
 Tabalyst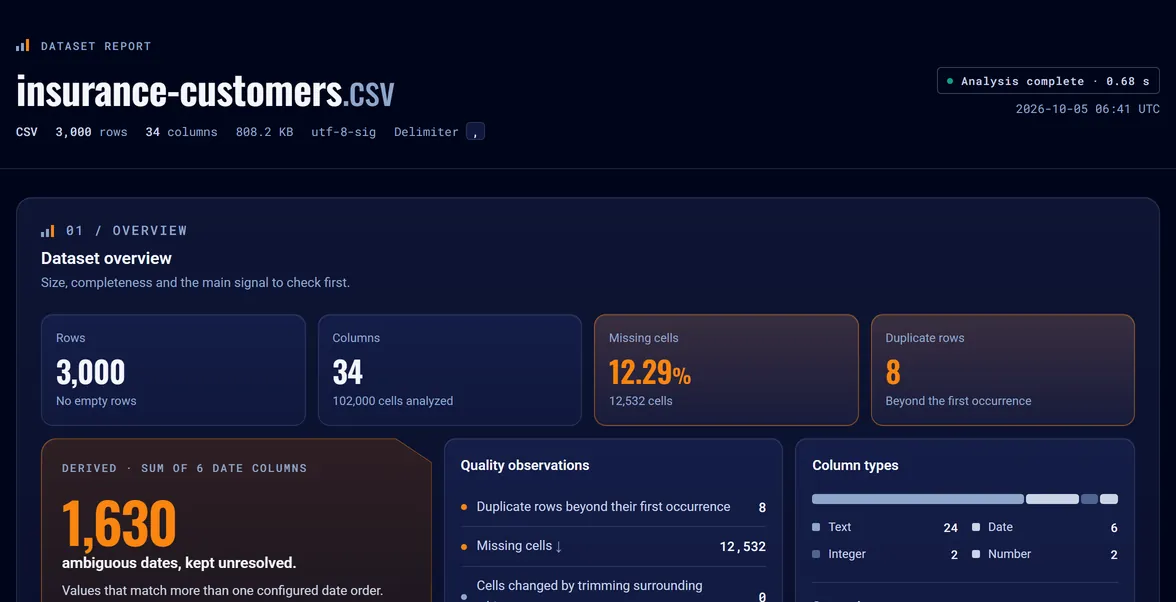
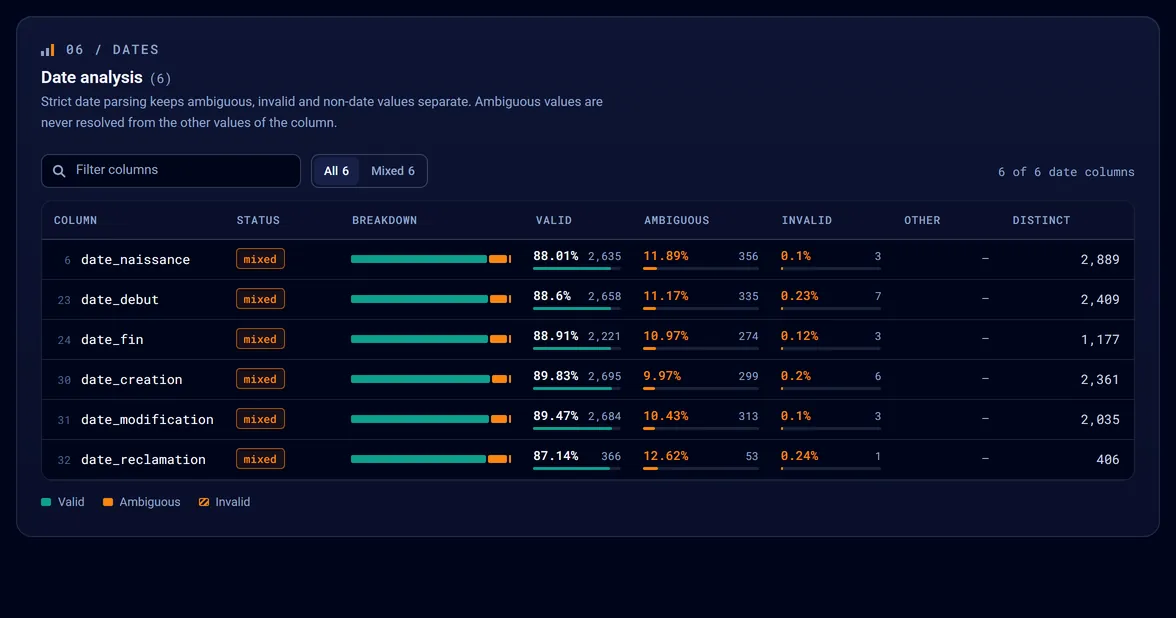
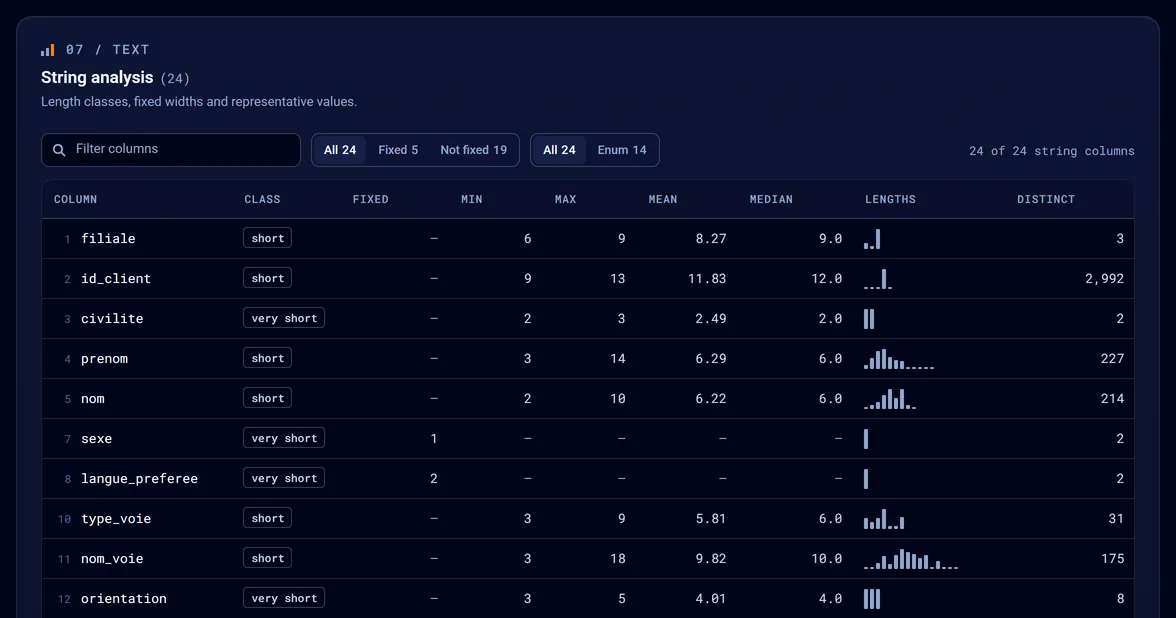
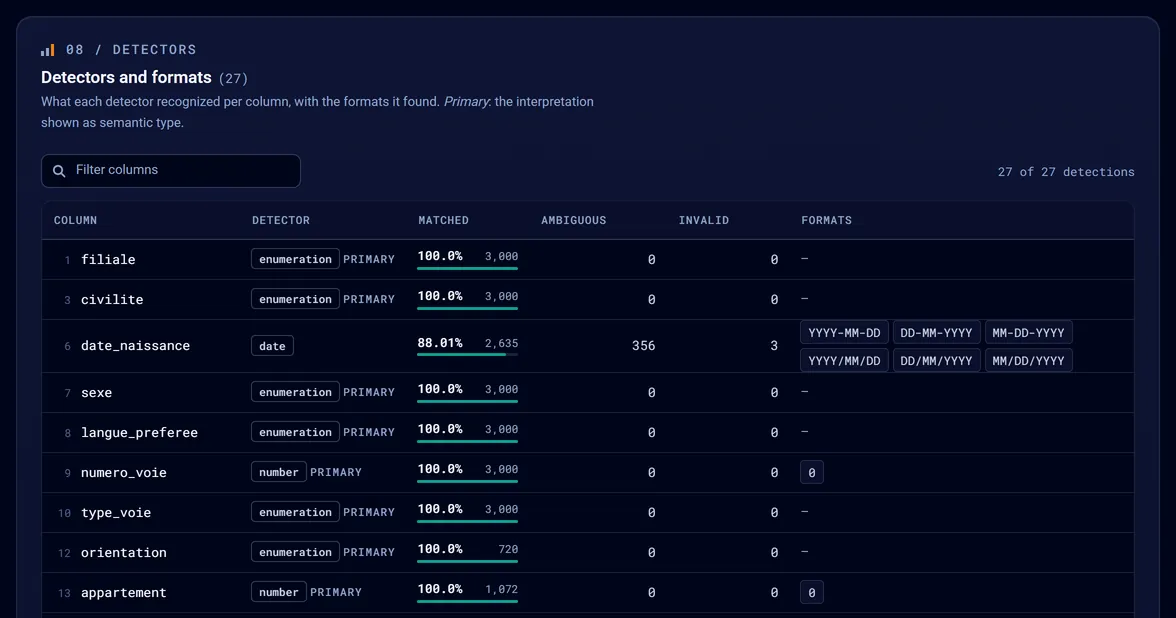
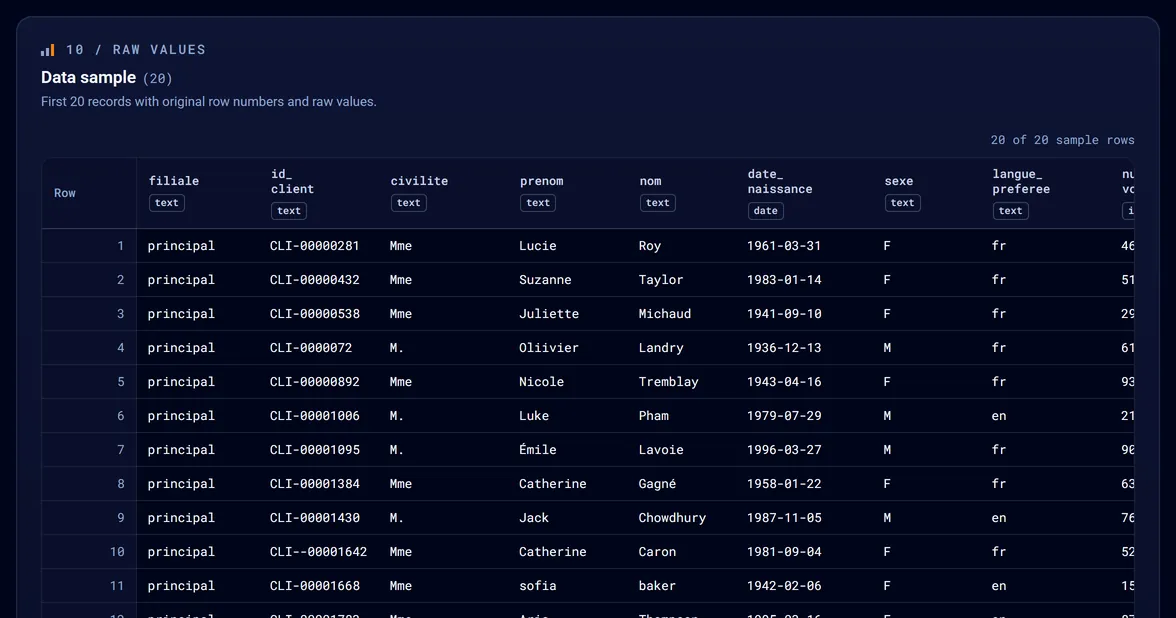
Types can be uncertain.
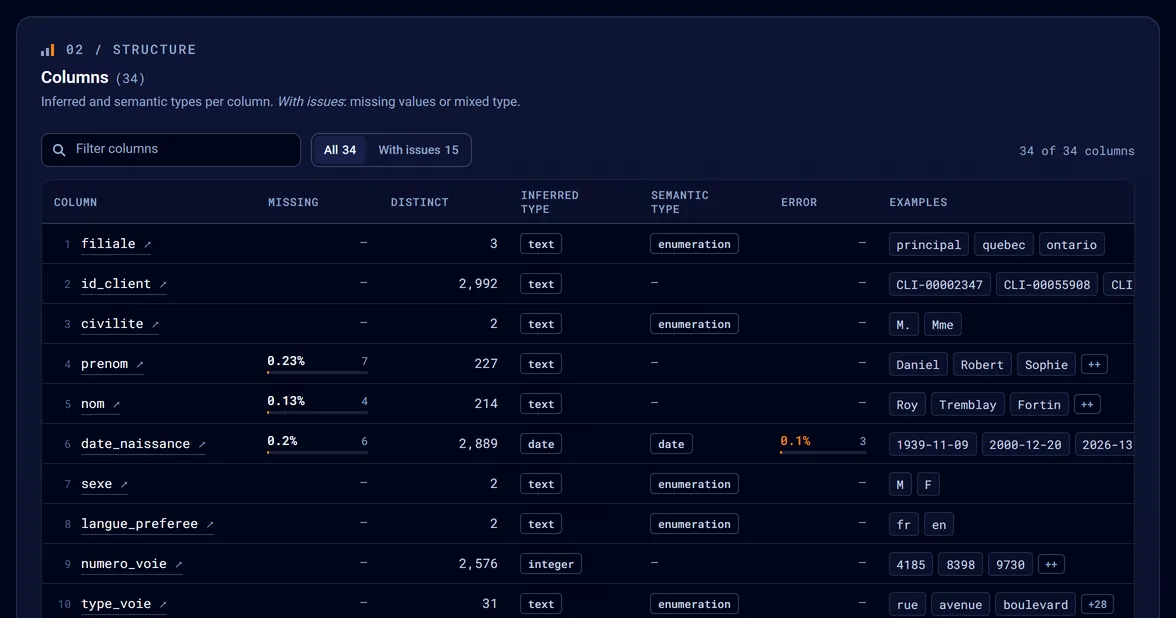
A column that looks like dates may mix formats, ambiguous values and impossible ones.
Tabalyst Report · Open source · CSV, Excel, JSON, JSONL
Tabalyst Report turns CSV, Excel, JSON and JSONL files into an interactive HTML report and a structured JSON profile. It reads the whole file locally and shows the missing values, mixed types and date ambiguity before they enter your import, analysis or pipeline.
pip install tabalystTabalystReport
Explore the report
Report
Analysis
Data
The first pass matters
Before an import, an analysis or a new pipeline, you need to know what the file actually contains. A manual skim rarely tells the whole story. The example below comes from a CSV; Excel, JSON and JSONL reports flag the same kinds of signals.
ambiguous dates.
They appear inside a column with 2,635 valid dates. A glance at the first few rows would miss the distinction.
What a skim misses
ILLUSTRATIVE ROWS| row | id_client | date_naissance | prime_annuelle | Annotation |
|---|---|---|---|---|
| 1 | CLI-10421 | 1961-03-31 | 1240.00 | |
| 2 | CLI-10422 | 04/05/1983 | 980.50 | day or month first? |
| 3 | CLI-10423 | 1105.00 | missing | |
| 4 | CLI-10424 | 1978-02-30 | 1310.00 | February 30th? |
| 5 | CLI-10423 | 1105.00 | same as row 3 |
A column that looks like dates may mix formats, ambiguous values and impossible ones.
Missing values and duplicate rows are easier to handle before a file enters your workflow.
Replace a one-off spreadsheet scan with a documented analysis your tools can reuse.
One clear chain · three steps
Analysis and presentation are separate. One analysis produces a JSON profile for code and a self-contained HTML report for people.
A CSV, Excel, JSON or JSONL file is read locally. Original values remain visible in the bounded preview.
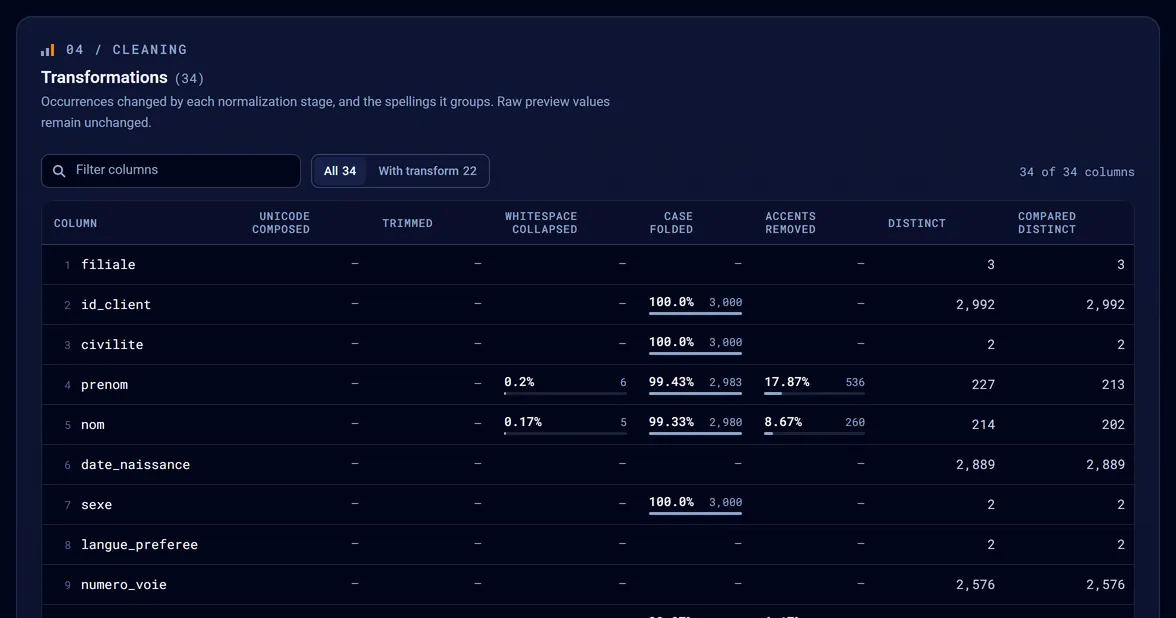
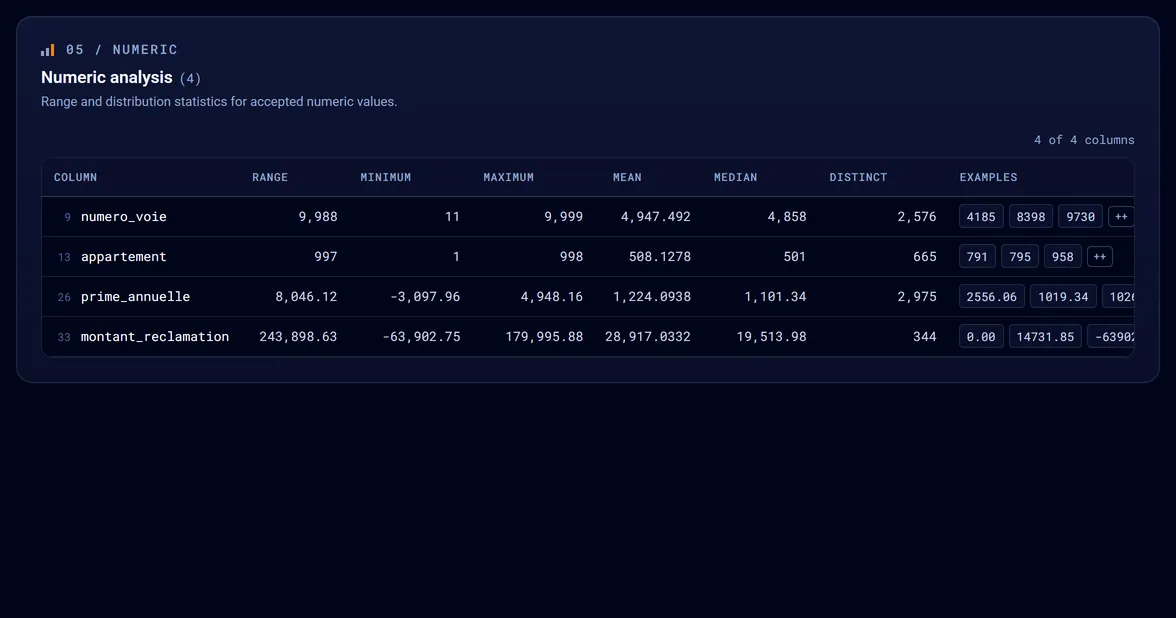
Types, missing values, duplicates, dates and patterns are profiled with explicit settings, whatever the format.
A structured profile for your tooling. An interactive report for exploration and sharing.
report.json is the canonical result. executions.json records successful analyses.
Tabalyst Report generates the structured JSON profile and the self-contained HTML report together.
Schematic rows, for illustration only. The example is a CSV file.
Run it now
Install or update the package, point Tabalyst Report at a file and open the generated report. One file or hundreds, the command is the same. Excel, JSON and JSONL work the same way: see Excel, JSON and JSONL. Use the configuration guide ↗ for separators, encodings and settings.
Beta, interfaces may still change · Python 3.11+ · Available on PyPI ↗
Use the public API when your file assessment belongs inside a script or pipeline. The return value is JSON-serializable, and the HTML report remains available for people to inspect.
The JSON profile is versioned but still young. Check the documented schema version before depending on fields across upgrades.
pip install --upgrade tabalyst# Also updates it: Tabalyst changes often
tabalyst report data.csv# data.html, data.json and executions.json, beside data.csv
tabalyst report *.csv -d reports/# One HTML report and JSON profile per file, all in reports/. Files are not merged.
import tabalyst # One fileresult = tabalyst.analyze( "data.csv", "reports/report.html", separator=";", encoding="cp1252", config_path="tabalyst.json",) print(result["datasets"][0]["summary"]["row_count"]) # Several filesbatch = tabalyst.generate_reports( ["*.csv"], output_dir="reports",)
Before the next step
Tabalyst Report gives you a first assessment of the file. You decide what to fix, reject or pass downstream.
Inspect column types and missing values before mapping a partner export into your system.
See the shape of an unfamiliar dataset before your first transformation or chart.
Review the file yourself and let your own tools consume the structured JSON profile where useful.
Scope, not hype. Tabalyst Report is a deterministic profiler, not an LLM. It does not generate AI recommendations or clean the file for you.
Four formats
The same two outputs for CSV, Excel, JSON and JSONL. Each format has its own page with a real report, its own command and its limits.
Profile an export column by column: types, gaps, ambiguous dates, duplicate rows.
Report one sheet or named table of a workbook, header found even under a title.
Report a collection of records, with nested fields named by their path.
Report one record per line, with invalid lines excluded, counted and listed.
Local-first · Built for big files
Tabalyst Report analyzes the file where it is, with no upload and no account. It adds no telemetry or remote processing.
The Python package runs the analysis on your machine. The generated report may contain values from the source, so review it before sharing.
Reports read CSV, JSON and JSONL files as a stream, with memory bounded by configurable limits. An Excel workbook is read sheet by sheet into memory.
Large files are a design goal, not a measured promise: no speed or maximum size is published. See the known limitations ↗.
More than reports
Tabalyst Report is the first tool of the Tabalyst toolkit. The others share its engine and its command grammar. A tool is linked here once its page is published.
Profile and inspect data from your CLI or Python workflows.
Understand your sources before ETL, migration or integration.
Understand the dataset before analysis or modeling.
Make data problems visible before their downstream effects.
Open by design
The code is MPL-2.0-licensed, and the configuration and execution history explain how each result was produced. Install it from PyPI, read the source on GitHub, and follow the documentation.
One engine reads the four formats, and the profile records which one was read.
An HTML report for people and a JSON profile for code.
MPL-2.0-licensed code, effective settings and a history of successful runs.
CSV, Excel (.xlsx and .xlsm), JSON and JSONL (.jsonl and .ndjson). Older .xls files are not read: save them as .xlsx.
No. The current Python package analyzes your file on your machine. The generated report may contain values from the source, so review it before sharing.
You need Python and a terminal to run the current version. A Python API is also available. A hosted option is planned, but it is not available yet.
Yes. tabalyst report *.csv -d reports/ writes one HTML report and one JSON profile per file. The files are not merged, joined or compared.
No. Tabalyst Report profiles a file and surfaces potential issues. It does not silently change your source or validate your domain-specific rules.
Yes. The analysis runs locally and the HTML report is a single self-contained file: it opens without an internet connection.
Reports read CSV, JSON and JSONL files as a stream, with memory bounded by configurable limits. An Excel workbook is read sheet by sheet into memory, and a sheet above 1 GiB of XML is refused. No speed or maximum file size is published.
Yes. The structured profile is designed for reuse in your own tools. Check the documented schema version when upgrading.
Your next file
Install Tabalyst and generate your own report with Tabalyst Report, or open a real report before you begin.